
 2 Minutes


Find the Story Behind Your Data
Your survey is complete & the responses are in. Now, it’s time for the big question: what is the data telling you? The answer might be spread across dozens of charts and crosstabs, making it easy to spend more time searching for the story rather than acting on it.
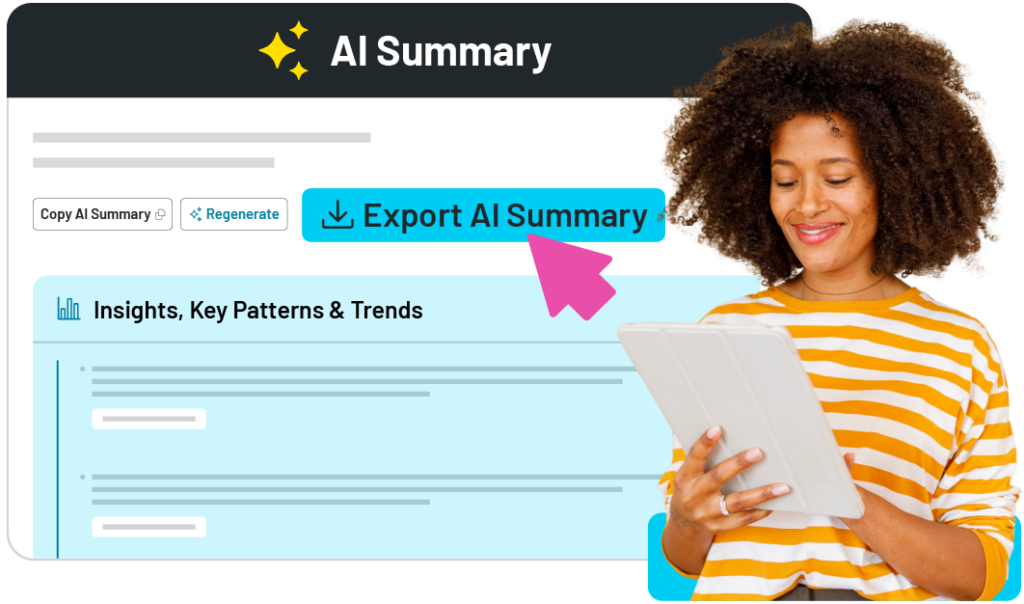
With Methodify’s new AI Report Summary, you can get to the “so what?” faster. AI analyzes your quantitative survey results and organizes the most important findings, patterns, trends and audience insights into a structured summary, giving you a clear starting point for deeper analysis.
And you don’t have to take AI’s word for it. Each key finding is cited and linked back to its supporting chart, so you can verify the source, explore the data and decide what deserves a closer look. The AI only uses data from your report and preserves your question-and-answer wording.
How it works:
- Open a Methodify report with at least 30 responses.
- Navigate to the AI Report Summary tab and generate your summary.
- Review key findings, patterns and trends, along with relevant stimuli comparisons, additional topics and a demographic breakdown.
- Click View source to open the chart supporting a finding or Go to question to explore it within All Questions.
- Review and validate the AI-generated content before using or sharing your findings.
Ready to spend less time working through charts and more time exploring what your results mean? Create a Methodify account and try it out for yourself today!